Is this the start of the bear market for crypto?
When it rains, it pours! Much like the recent month in cryptocurrencies, negative news and FUD (Fear, Uncertainty and Doubt) have poured down to dampen the cryptocurrency market. Black Friday came early for the crypto world, and most coins are on a half-price sale, but is this the start of the bear market, or are we ready for another leg up?
When looking at assets to invest in, do some homework and analyse the hard facts. Facts have innate power; they cut through all the clickbait you see and show you an unbiased view of what’s really going on.
A general rule of thumb — always look at what’s going on under the hood — you’ll never know if a car is broken by looking at its paint job.
In the traditional world of finance, an analyst’s role is to evaluate a company’s value based on specific market metrics and accounting cash flows. These methods of evaluating can be very complex and require a lot of information that is not easily accessible; for cryptocurrencies, this is slightly different.
It’s called on-chain analytics, which is a live stream of cryptocurrency data ranging from the number of new users (showing coin adoption and growth) to wallet profiles, for example, how many unique Bitcoin addresses haven’t moved their coins in over five years (long-term holders).
With this data, we can paint a pretty good picture of what the future of cryptocurrencies could look like.
Here are the five data-driven reasons that this bull run still has some way to go:
- Stock-to-“Dough”
The Stock-to-flow model (S2F) was developed as a simple model to value scarce commodities like gold. The S2F ratio shows the current stock of a commodity (current total supply) against new production flow (amount mined that specific year).
For store of value (SoV) commodities such as gold, platinum, and now Bitcoin, a high ratio indicates that they are mostly not consumed. Instead, the majority is stored as a monetary hedge, thus driving up the S2F ratio.
A higher ratio indicates that the commodity is increasingly scarce, and therefore more valuable as a store of value.
In the world of cryptocurrencies, PlanB created a live S2F model for Bitcoin.
In the chart below, the Bitcoin price is overlaid atop the S2F ratio line. We can see that the Bitcoin price has continued to follow the S2F of Bitcoin over time. The theory, therefore, suggests that we can project where the price may go by observing the projected S2F line, which can be calculated as we know the approximate mining schedule of future Bitcoin mining.
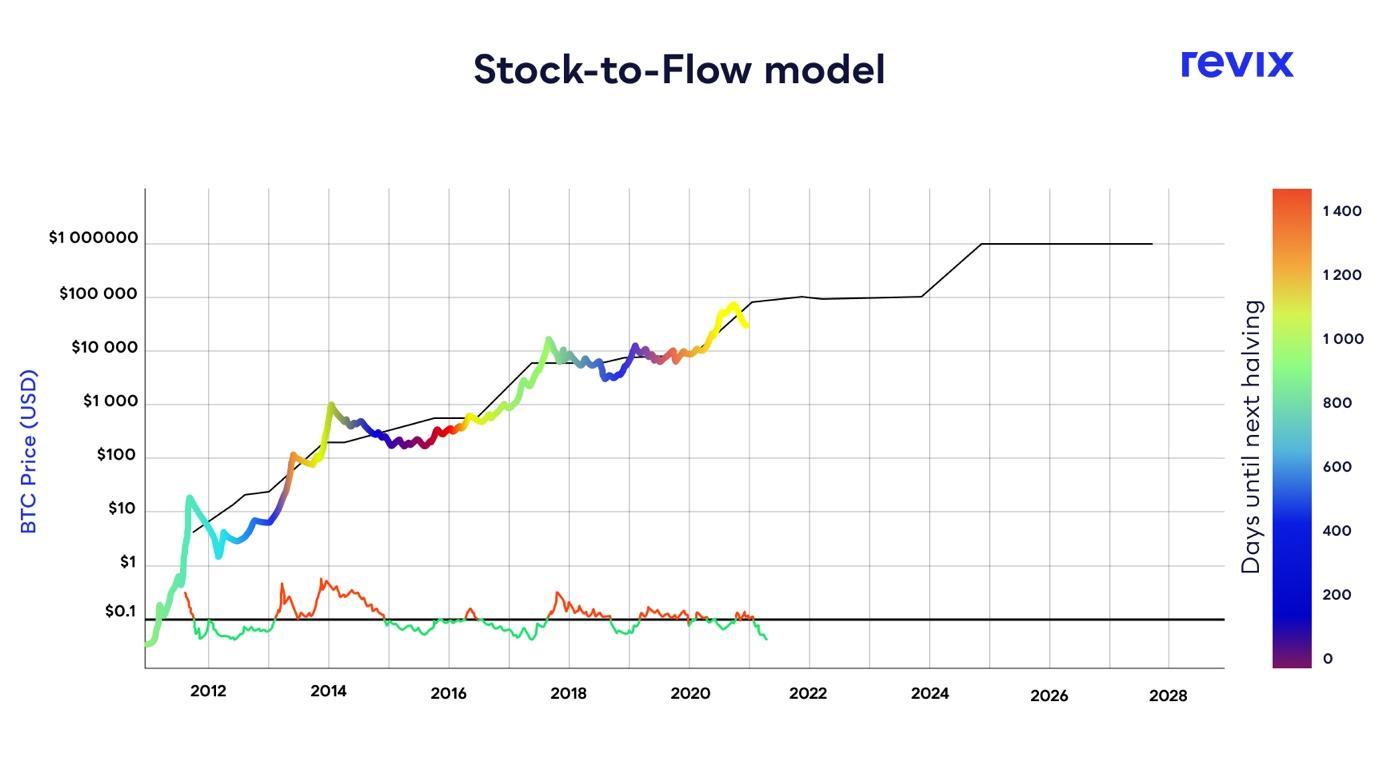
The S2F model predictive price is currently at its biggest ever recorded divergence from the actual price. This model shows Bitcoin to be at $86 000, while its price trades at around $34 000 (a 60% discount to the S2F price). This divergence has been a great predictor of price bottoms. The model also predicts that Bitcoin will be at $1 000 000 a coin by 2025.
- The long game
It’s always a smart idea to look at long term price data using a good old log graph, for the simple reason that price changes are hard to display on a linear scale and can be misleading over an extended timeframe.
For example, there is a fundamental difference if a stock worth R100 moves up to R110
(a R10 increase), or if that same stock were to increase from R20 to R30 10 years ago. A linear graph would display both R10 increases as the same proportional move on the chart, despite them being very different in regards to price appreciation!
A log graph would indicate that the R20 to R30 move is a 50% price appreciation, while the R100 to R110 is only a 10% price appreciation and would scale them accordingly.
So, when evaluating long term trends, always consider looking at price charts in logarithmic terms for clarity.

Above, we can see the log price chart for Bitcoin and how it’s following a clear upwards trend. Based on this evaluation, we can see that this bull run still has some way to go before Bitcoin hits the upper band at $132 000.
- Don’t look at what they say; look at what they do
“Most news nowadays is just there to distract you from what’s really going on. This is why you should try to cut through the noise. A mentor of mine once gave me a piece of advice that seems to ring true in this situation. He said, never believe people on what they say, but rather on what they do,” mentioned Brett Hope Robertson, Investment Analyst at investment platform Revix.
Below is a graph that indicates that the famous “whales” (people who hold more than 1 000 Bitcoins) are starting to buy up Bitcoin at these levels, with July showing the most significant one-day spike seen in the last year. All this happening despite all the “negative press”? Yup! There’s never a dull moment in the world of crypto. 
We have also seen $1.3-billion worth of Ethereum or 0.5% of the total Ethereum supply move off exchanges in a single day! This was one of the largest single moves seen this year.
“When coins move off exchanges, it means that buyers have decided to move their coins to cold storage or personal wallet. This shows the market that buyers don’t intend to sell their coins anytime soon and that long term demand is increasing,” Robertson continues.
- Positive Supply Shocks cause price increases
The Bitcoin liquidity supply ratio (Blue line) shows the number of coins held by participants with little history selling (strong hands) divided by the number of coins held by speculative participants (weak hands).
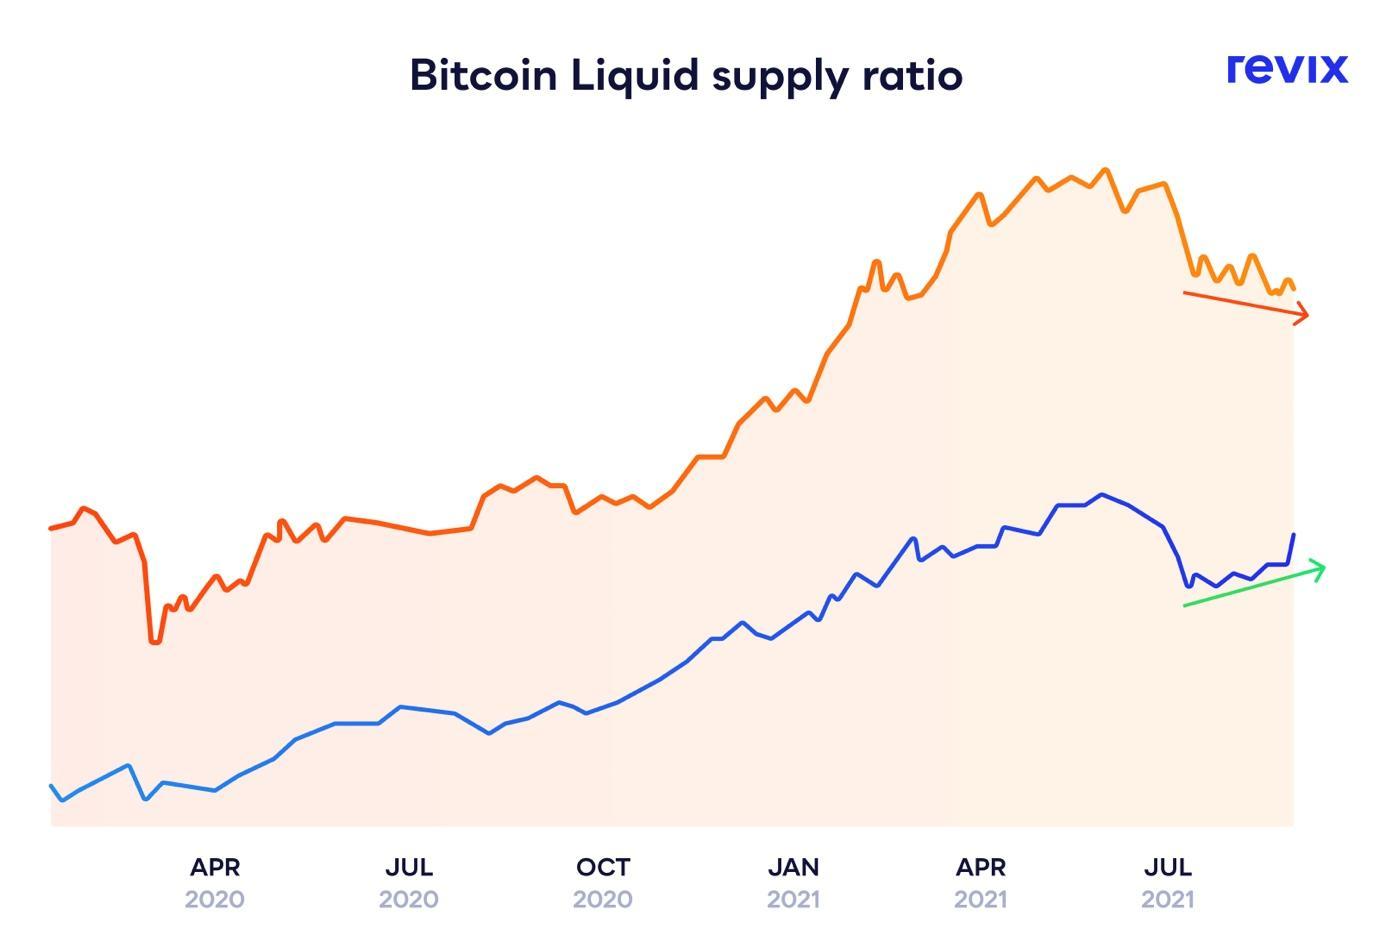
We can see that long-term holders are starting to accumulate coins from retail traders who have been shaken out in the most recent Bitcoin price drop (Orange line).
Another factor is the Supply Shock Ratio (Blue line); this is the total coin supply divided by the coins available on exchanges. As coin availability on exchanges reduces in relation to the supply, this contributes to increasing supply shocks (Blue line increasing).
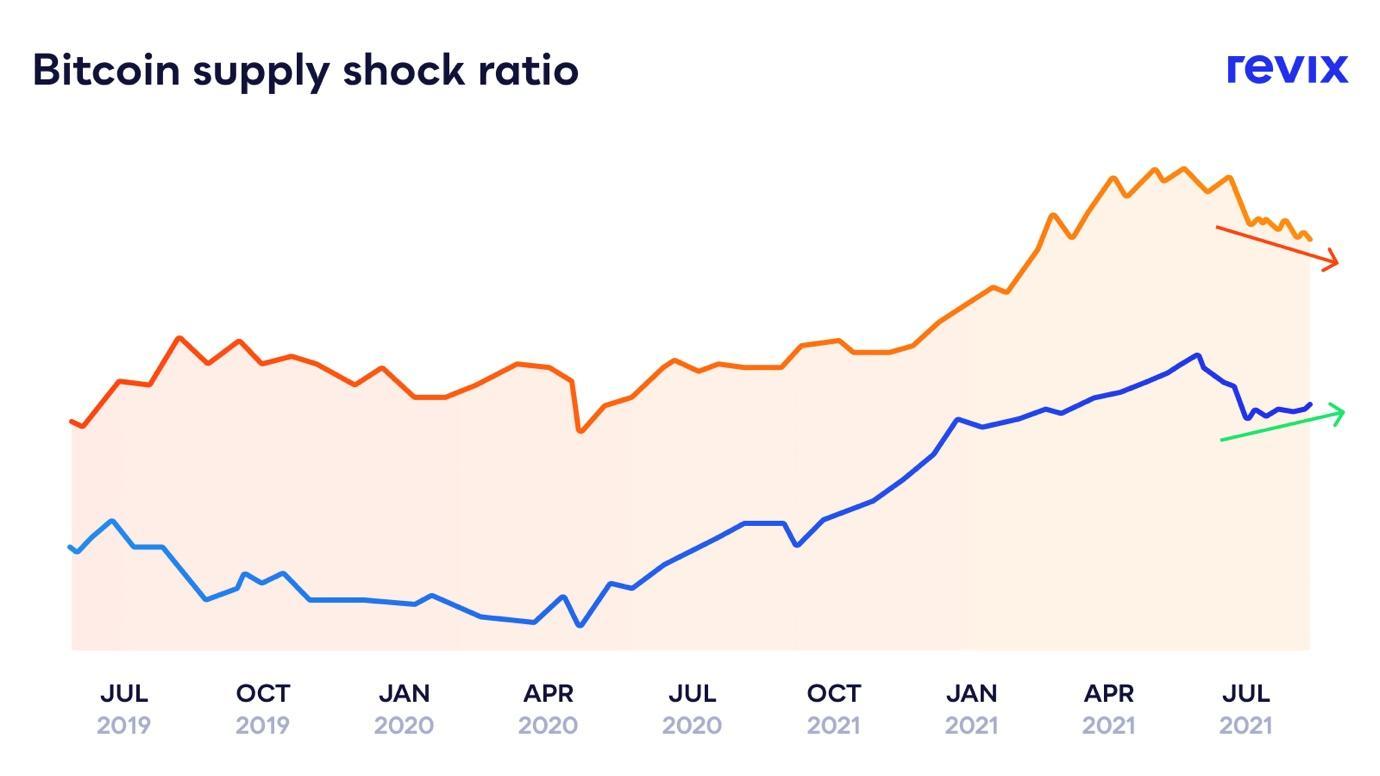
We can see that this line is increasing while the Bitcoin price (Orange line) has been decreasing. This leads to the fact that coins are being moved off exchanges in anticipation of long-term growth.
- The unlikely hero
China’s recent crackdown on Bitcoin mining may have contributed to its price weakness over the last month, but long-term, China may have just stepped up to be the unlikely hero for the Bitcoin Bull Case.
It’s no secret that Bitcoin mining in China accounts for over two-thirds of global Bitcoin production (66%). This led to concerns that Bitcoin mining was overly concentrated in one region of the world, which would expose the network to the risk of outages and political interference.
This paints a pretty ugly picture for the centralisation risk of the crown cryptocurrency — but what if we take a look at the situation from a different perspective?
Ever since China announced its ban on Bitcoin mining operations, the ecosystem has started to migrate to North America and Kazakhstan, where there is cheap energy, and the hosts are more open to Bitcoin Mining.
“This is a massive deal,” Robertson says, “This migration will start to decentralise the previously centralised Bitcoin hashrate. It is probably one of the most significant steps Bitcoin has taken towards true decentralisation, and it will allow for the fear of hashrate concentration to finally be put to bed.”
China has been at the forefront of banning multiple tech innovations, but that hasn’t stopped these tech companies from taking over the world as we know it. Twitter, Facebook and Google all have something in common: they have all been banned by China at various times. “Actually, Chinese technology bans have proven to be quite a good buy signal over the years,” Robertson points out.
The below table shows returns of tech innovations banned by China.

The five data-driven points above show that there is still a lot of life left in this bull. On a long-term basis, Bitcoin, and in turn, cryptocurrencies are just getting started.
“Buying Bitcoin is a great way to get exposure. But you know what’s better? Buying Bitcoin and owning the next Bitcoin. The best fund managers in the world know that to be successful, you need to be one of two things: be smarter or be first. Unfortunately, no one is smart enough to know which cryptocurrency project will win this race 10 years from now, and anyone who says they do is lying.
Therefore, the easiest way to be first is to invest in a bundle of the top cryptocurrency projects and sit back while they fight for dominance,” says Robertson.
At investment platform Revix, you can gain access to their ready-made “crypto bundles”. These bundles allow you to own an equally-weighted basket of the world’s largest and, by default, most successful cryptocurrencies.
You don’t have to try to guess which up-and-coming cryptocurrencies will become the next Bitcoin since you’ll own a diversified basket of cryptos that gets automatically updated every month based on how the crypto market has performed.
Diversification works in every asset class in the world. It should come as no surprise that it works in crypto as well.
For more information about crypto bundles, or a direct way to invest in Bitcoin or the Ethereum cryptocurrency ether, visit Revix.